Lake Martin Real Estate Sales – 2008 Year In Review
Why Lake Martin Real Estate Buyers Can’t Time The Bottom
February 3, 2009
Reasons Why Banks Will Struggle To Sell Lake Martin Foreclosures
February 12, 2009Lake Martin Real Estate Sales – 2008 Year In Review
The waterfront property sales in the Lake Martin MLS* ended the year by tying 2007’s December sales of 4.
When we looked at November 2008 sales for Lake Martin, we saw that 2008 monthly sales were starting to beat 2007. How did we finish the year?
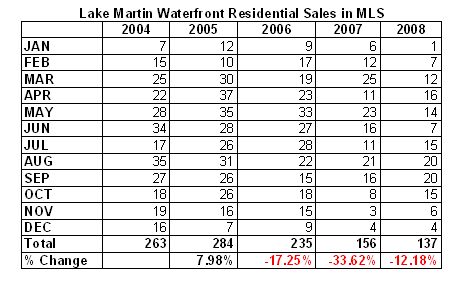
On a whole, 2008 proved unable to beat the infamous drought year of 2007. In total, 137 waterfront homes were sold through the MLS on 2008, which was about 12% less than 2007’s number of 156.
Check out the graph of cumulative sales:
To put this decrease into perspective, see the below chart. It shows by month, sales of waterfront Lake Martin residences in the MLS. You can see the decrease of number of sales from 2007 to 2008 of 12%. Also consider that this is the third year in a row of consecutive decreases.
|
What did prices do on Lake Martin in 2008?
Another natural question is to look for evidence of falling prices in such a strong buyer’s market. If you compare 2007 to 2008, it is interesting to note that at the low end and the high end, 2008 actually had more sales. As always, there are some sales that report “0” as the sales price. If you take these sales out, it looks like:
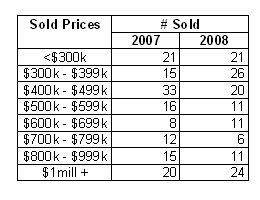 |
Looking at the sales, I think this was due to many sales of leased lot mobile homes on the low end, and spec homes on the high end. Of the 24 homes sold at or above $1 million, about 14 were in the Ridge.
But this still does not give us any real feeling of a basic question that I get asked all of the time: Are Lake Martin sellers finally dropping prices?
I have said this many times before, but I will repeat – the Lake Martin area real estate market, especially waterfront property – is a relatively small pool of sales statistics from which to draw. Sure, the lake itself is huge, but in terms of number of sales, we are small even by Alabama standards. When you try to draw too many broad conclusions from a small set of data, you get weird results. Nevertheless, I thought I could see some interesting trends if I looked at statistics like Total Sales Volume, Days On Market, and Average Price. Check out these factoids covering 2005 – 2008:
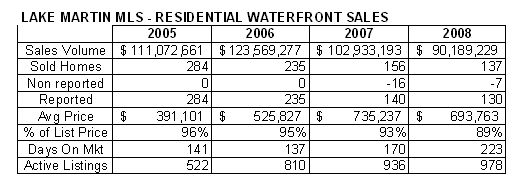 |
Most of these factoids seem pretty logical and follow the pattern that we by hindsight know – that 2005 was the peak of an extreme seller’s market, and 2006 saw a transition to a buyer’s – and by 2008 we are at the other end of the spectrum, and extreme buyer’s market. The Sold Price as a % of List Price decreases. OK, check. I get that. Average Days on Market for sold listings dramatically increase, OK. Active Listings balloon, almost doubling. Right.
But wait – Lake Martin Average Price INCREASES? Sure it came down a little in 08 but did it almost DOUBLE from 05 to 07? That is counter intuitive. My gut tells me no. My gut tells me that the average is badly skewed by a few high sales prices, and since 2008 sold less than 50% of homes than 2005, it affects the average a lot more.
So is my gut correct? Only one way to find out.
Searching For A Bell Curve
What will Lake Martin sales look like if I break them up into price categories and then divide by total sales? For example, in 2005, there were 77 homes sold in the $200k – $299k price range, and 284 total that year. 77 divided by 284 is about 27%. That’s what gives you the peak in 2005’s line below. It removes influence of the amount of each sale, and merely looks at each price category as it relates to the whole. Then we can see how much each particular year is influenced by low or high end sales. Here it is:
|
If you care to view the numbers behind the chart, click here.
I believe that this graph clearly shows that the average reported waterfront sales prices of residences on Lake Martin in 2008 was definitely skewed by an unusually large percentage of high end sales. The aqua line represents 2008. Fully 18% of 2008 sales were above $1 million – while only 2% were in 2005. 18 divided by 2 is 9 – 9 times more greatly influenced by the high end. That’s NINE TIMES, Ferris. Nine times.
Well, this is because things got more expensive, you might say. No, I disagree. If all prices increased, we would see more of a shift of the entire curve – as we saw from 2005 to 2006. You can see that the peaks of 2006 and 2007 are definitely ahead of 2005 – to me a clear sign of overall price increases. But check out what happens to the peak in 2008 – it drops back!
On all but the top 20% of sales on Lake Martin, 2008 was a year of decrease prices! How much I am not willing to say. Remember, we’re dealing with small samples. For example, to look at this graph and say, since the peak in 2006 and 2007 was in the 400s, and it dropped back to the 300s in 2008 – it would be incorrect to think that the whole market decreased 25%. But I do think it is OK to say we experienced a downward trend.
SO WHAT MATH NERD??!? WHO CARES? HOW DOES THIS HELP ME?!?
I can think of several applications for 2009:
BUYERS:
1. Anyone that has been waiting until prices come down can quit waiting. It is happening.
2. Observe that for sellers, their sweet spot came in 2006, when prices were still rising even though more and more homes were flooding onto the market. It took them a while to catch on that the end was coming. HOW LONG WILL YOU WAIT TO BUY?
3. This cycle WILL swing back. Will you be burned like some sellers were in 2006, gambling that prices would rise again in 2007, only to be hit with the drought then the bank meltdown? When else in history have buyers had this perfect storm on their side?
SELLERS:
1. This should show you that now, more than in the last 4 years, buyers are extremely price sensitive. They are reacting to aggressively priced homes, not homes with crazy list prices.
2. There are TONS of other homes on Lake Martin for sale. The buyer can pick among several good candidates. You are not as special as you were in 2005.
3. Know your competition – look at your home and decide, what price point would I be in? What would be my competition? Regardless of the price, be competitive within that category. Also, choose a price that justifies not stepping up or stepping down.
In Summary
Sorry for the long post, but I just couldn’t break this info up and it make any sort of sense.
Please note that I am not trying to break the news that it’s a buyer’s market and prices are dropping. That’s obvious. Similarly I realize I am not the first to discover the bell curve. But – I do think it is tremendously exciting to finally have a mechanism to observe pricing trends that isn’t too mangled by our small sample size.
Call me a dork, but I love it. I love Lake Martin real estate, so to me this is big. Indulge me, OK?
(*)Disclaimers: All of the above info was taken from the Lake Martin Area Association of Realtors Multiple Listing Service. Accuracy is not guaranteed but deemed reliable. The above does not include sales by FSBOs or developers that sell privately and not through the MLS. But, I do think that the above represents a very large majority of all sales on Lake Martin.
Related Posts:
