November Home Sales On Lake Martin Mirror Last Year
Tour of Parker Creek Marina on Lake Martin
December 30, 2010Lake Martin Concrete Seawall Construction
January 2, 2011November Home Sales On Lake Martin Mirror Last Year

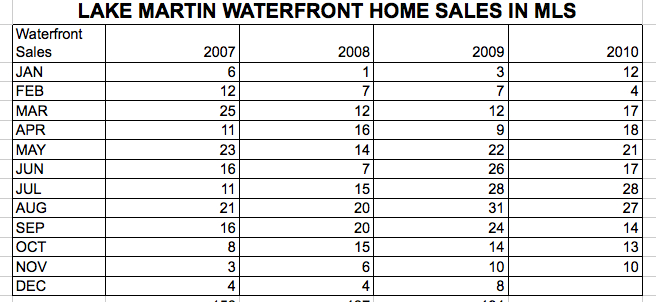
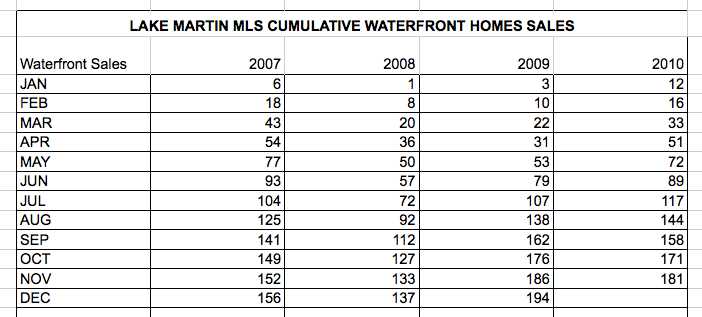
Ten waterfront homes were sold in the Lake Martin MLS in the month of November, 2010. This equals the ten sold in November, 2009, and brings 2010’s total to 181, slightly behind 2009’s November total of 186.
 |
I don’t have too much analysis to add here except to say that November 2010 continues the trend of pretty much equaling last year. Normally that wouldn’t be too exciting news, but since 2009 was such a comeback year from the low of 2008, we will take it. Yesterday I read a big headline in my beloved Wall Street Journal that analysts fear the double dip in national real estate markets. A 2010 that is stable as compared to last year I think gives great evidence that Lake Martin will be able to avoid a double dip. Most markets that fear another slide have not really recovered from the first one.
 |
In short, we have much to be thankful for at Lake Martin. When you look at cumulative totals, we see that through November, 2010 scored 181 sales as compared to 2009’s total of 186.
Next is the all important chart where I look to compare each month’s sales to the same month last year. In my opinion this is the key factor to judge the momentum or direction of Lake Martin’s real estate market health. Since November 2010 equaled 2009 at ten, we are back to the zero axis.
I use Google Spreadsheets to make these, and Google updated their chart software. My charts are all wacky looking now. Instead of spending hours to figure this out for this month, I am going with it this month and hope to fix it for the year end review.
Gearing Up For The Year End Review
As a recovering accountant, I still twitch a little bit when I hear the term “year end.”
When I rolled up year end numbers for a privately held company, it wasn’t so bad. But publicly traded companies are a different animal altogether. All of us nerds in the accounting departments started to wince about December 15, knowing the pain that was ahead until March 1 or so. The heavy hitters from sales and production would actually stop by our cubicles and ask how it was going. It was nice to be noticed, I guess, but mostly it made us more nervous. We worked round the clock for weeks. It was kind of like studying for finals at college, except we wore cheap ties, had constant coffee breath, and it wasn’t fun. OK, maybe it was nothing like college.
However, year end in the Lake Martin real estate market means I get to indulge myself by rolling around in numbers that are a lot more fun. I get to slice and dice and revel in the nerdliness of the numbers. Because I do many more attempts at analysis, this post usually comes out in early February, so please be patient.
What To Expect
Nothing really shocking will be revealed. Total waterfront home sales on Lake Martin will pretty much track with 2009. Waterfront lot sales were up, though, and we will take a look at that.
The most fun part of it to me will be finally being able to calculate pricing trends. Lake Martin is a small market with a relatively small number of sales. Therefore our sample size is small, and prohibits (in my opinion) cogent average price analysis on a monthly basis.
Stay tuned!
Related Posts (I recently edited these links to make sure they work):
Lake Martin Real Estate Sales – October 2010
Lake Martin Real Estate Sales 2009 – Waterfront Lots
Lake Martin Real Estate Sales 2009 – Year In Review
Lake Martin Real Estate Sales 2008 – Year In Review
Lake Martin Real Estate Sales 2007 – Year In Review
All Lake Martin Market Reports
(*)Disclaimers: All of the above info was taken from the Lake Martin Area Association of Realtors Multiple Listing Service. Accuracy is not guaranteed but deemed reliable. The above does not include sales by FSBOs or developers that sell privately and not through the MLS. But, I do think that the above represents a very large majority of all waterfront sales on Lake Martin, Alabama.

