Lake Martin Waterfront Home Sales Beat Prior Year
New Birding Trail Opens In Lake Martin Area
November 26, 2011
Winterize It, Don’t Criticize It
December 6, 2011Lake Martin Waterfront Home Sales Beat Prior Year

 It’s official, Lake Martin waterfront home sales in 2011 will be better than 2010.
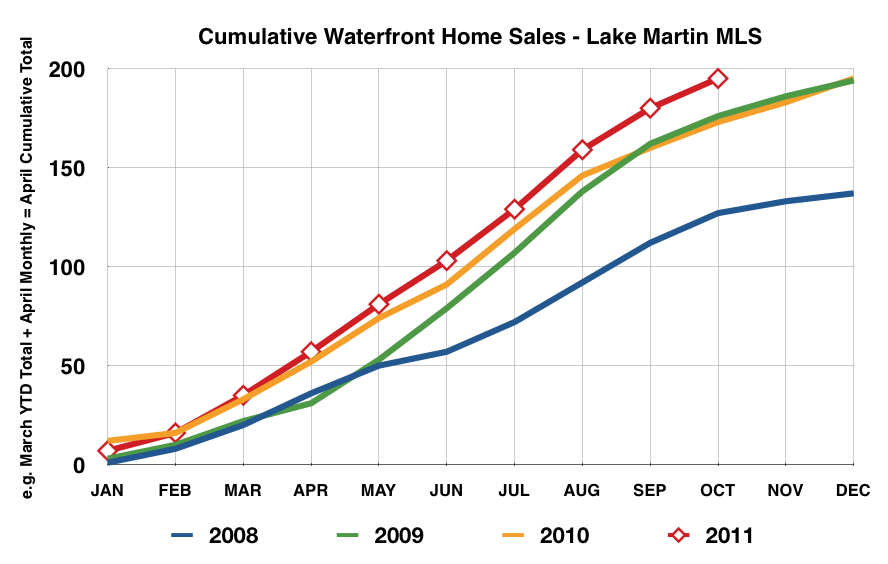
Through October 31, 2011, 195 waterfront homes were sold on Lake Martin. If you check the Lake Martin real estate market for the entire year of 2010, you see that it took the full 12 months to reach the 195 level, and 194 were sold in 2009.
Since unofficial November 2011 results show that at least a few waterfront homes sold, one can confidently say that we beat the prior year of 2010.
My conservative guess is that the Lake Martin real estate market will finish 2011 with about 205 waterfront home sales. That equals an approximate 5% jump from 2010, and about 49% up from the post bubble low in 2008.
Lake Martin Waterfront Home Sales By Month
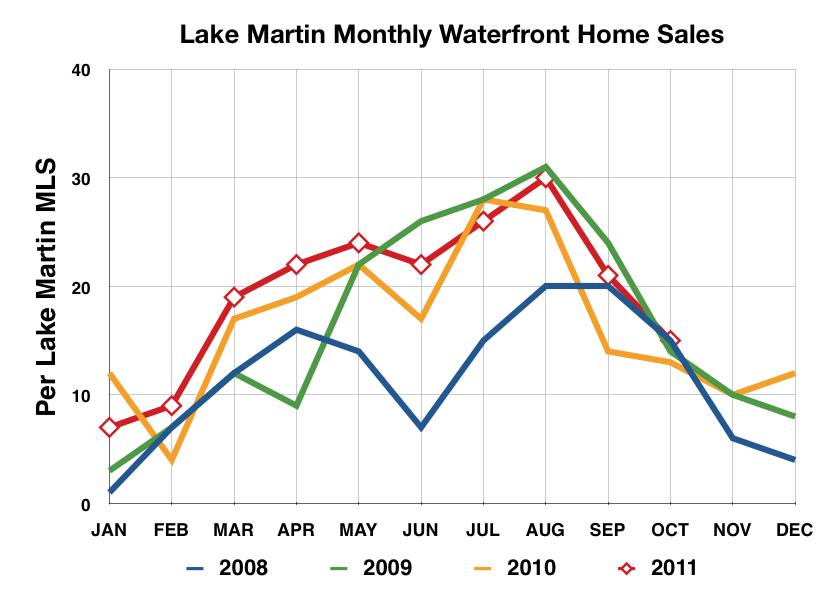
The below chart shows Lake Martin waterfront property home sales by month. It is from January 1, 2008 to October 31, 2011. You can see that 2011, at a monthly level, beat 2010 at almost every month. Please keep in mind that these numbers come from the Lake Martin MLS*, and reflect only waterfront home, condo, and town home sales by all members of the Lake Martin MLS, all brokerages.
 |
Cumulative Lake Martin Waterfront Home Sales
If you take the monthly sales numbers for the Lake Martin real estate market and add them together, you get the cumulative sales results. To me it is a bit easier to judge at a glance on this chart to tell how the year in total is trending versus prior years.
Please see the below chart. Here again I start at the post bubble low year of 2008 and bring it through October 31, 2011.
 |
Lake Martin Home Sales Versus Same Month Prior Year
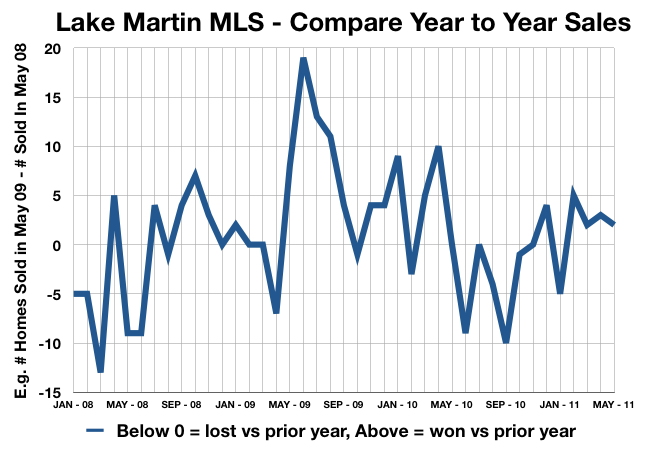
Of all the numbers I crunch, of all my nerdly charts, the below one is the one I watch the most. It tracks how each month fares versus the same month in the prior year. For example, in October 2011, 15 waterfront homes were sold on Lake Martin. October 2010 saw 13 sales, all agents, all brokerages. That gives us a +2 rating for the current month.
Any positive number here is good. If I see several months in a row of negative numbers, I know that Lake Martin is in danger of stalling again. If we had been watching closely in 2006, we could have seen this coming.
The second home market here at Lake Martin has been on a win streak since since mid 2008. Has 2011 kept it rolling? The answer is yes.
 |
Lake Martin Waterfront Lot Sales
Has the momentum in home sales been mirrored in Lake Martin lots?
The answer for 2011 has been yes.
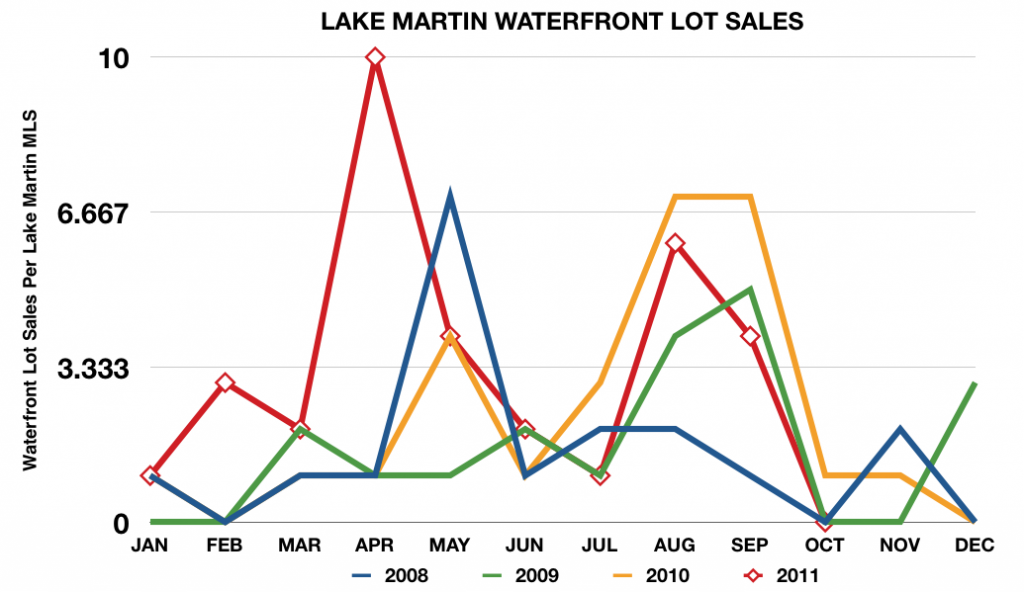 |
While October 2011 itself racked zero waterfront lots sold, the year in total has been a runaway success. Through October 31, thirty three lots have sold in 2011. Compare that to 27 for all of 2010, and you see a hefty gain. Consider that 2010 was the lot comeback year, and you can appreciate the gravity of 2011’s success.
With the benefit of hindsight, we can see that 2008 and 2009 represented a two year divot for Lake Martin lot sales.
I like lot sales because they are a general barometer of construction potential. Let’s hope that our construction industry feels the trickle soon.
Related Posts:
Lake Martin Real Estate Sales 2011 – Through May
Lake Martin Real Estate Sales 2010 – Lot Sales
Lake Martin Real Estate Sales 2010
Lake Martin Real Estate Sales 2009 – Year In Review
Lake Martin Real Estate Sales 2008 – Year In Review
Lake Martin Real Estate Sales 2007 – Year In Review
All Lake Martin Market Reports
(*)Disclaimers: All of the above info was taken from the Lake Martin Area Association of Realtors Multiple Listing Service. Accuracy is not guaranteed but deemed reliable. The above does not include sales by FSBOs or developers that sell privately and not through the MLS. But, I do think that the above represents a very large majority of all waterfront sales on Lake Martin, Alabama.

