Lake Martin Home Sales Post Best May Since 2006
The Lake Martin Day Trip: Have Boat, Will Play
June 15, 2011
My Big Mistake, Caught On Video
July 1, 2011Lake Martin Home Sales Post Best May Since 2006

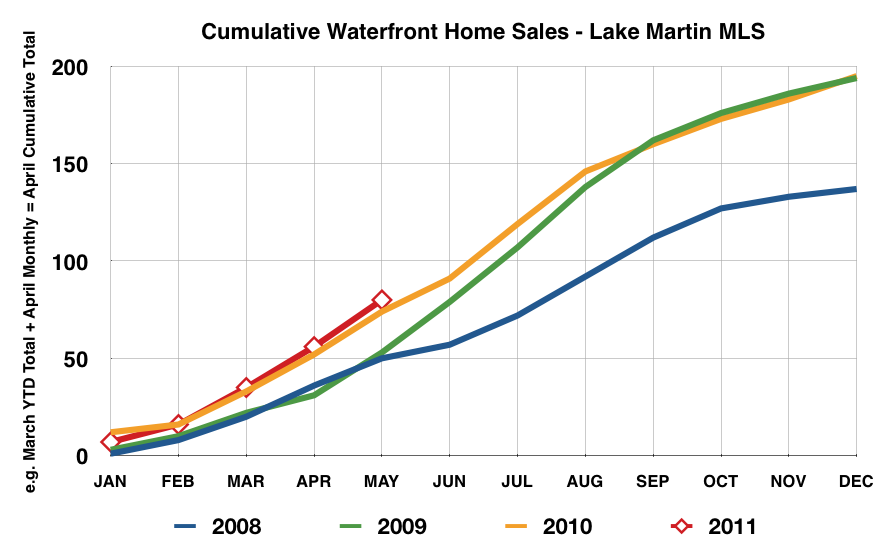
May, 2011, was a great month for waterfront home sales on Lake Martin. A total of 24 lakefront properties were sold on the entire lake – all brokerages, all agents. This is the highest number of Lake Martin homes sold in the month of May since 33 were sold in 2006. It beats the 22 sold in May of 2010 and 2009, the 14 sold in 2008, and 23 sold in 2007.
When I pull the numbers from the Lake Martin MLS*, I find that 2011 is trending to be yet another strong year for us, perhaps to be the third year in a row that we will have bested the prior year in waterfront home sales.
 |
Please note that in the above chart, and for the all charts going forward, I plan to quit showing 2005 – 2007 data, unless I am trying to make a specific point.
My reasons for this are:
1.) Visually, it’s hard (for me at least) to look at so many years on one chart. They just all mix together and lose context.
2.) It is my sincere belief (backed up by the numbers) that 2008 was the bottom of the Lake Martin real estate market. “The bubble” is old news. Instead of focusing on how off we are from 2005, I think the more pertinent topic to people interested in buying or selling on Lake Martin now is: how high up are we from the bottom? And, are we in danger of dipping back down again? To highlight these topics I need more space, and 2005 – 2007 must go.
I’m not throwing away the data or anything, I can always trot it back out of needed.
The below chart will show you the trend of waterfront homes sold on Lake Martin for 2011. We are trending about 10% above 2010, which suggests that we will end up selling about 50% more homes this year than in the bottom of 2008.
 |
See The Momentum
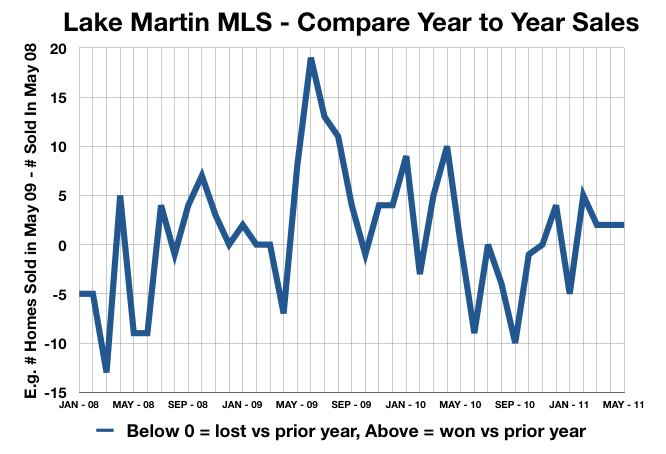
I am a firm believer that in order to understand the direction any real estate market, anywhere, at any time, one must study the comparison of year to year monthly sales. In other words, did the number of homes sold this month beat the same month last year? And how many months’ of victories have been tallied in, say, the last running 18 months? The answer to this will tell you that market’s momentum, and give you insight to the likely direction of pricing.
Yes, that’s right. I’m saying pricing trends follow sales trends. If home sales go up, so will prices. Dropping sales will drop prices.
What is the real estate sales trend for Lake Martin? Why am I so confident that we are at a low (relative) risk to a double dip? See this chart:
 |
The above is a chart of the numbers of waterfront homes sold on Lake Martin since January 2008. It shows the result of taking the current month homes sold and subtracting the same month in the prior year. Take January 2008 for example. It sold 5 fewer homes than January 2007, thus the -5 position on the chart. Ditto February 2008. But in June 2009 – we see it sold 19 more homes than June 2008, so it registers a big blip up. The key here is to focus on that zero line on the y (vertical) axis. Anything above that is “good” – aka an increasing sales momentum. The reverse is also true.
I have often cited this chart, but it is proof positive to me that Lake Martin is still on an upswing from the real estate bottom. Furthermore, you can see from the chart that in 2008 it swung from mostly negative numbers to mostly positive.
This is excellent news. We are very fortunate here.
Waterfront Lot Sales On Lake Martin
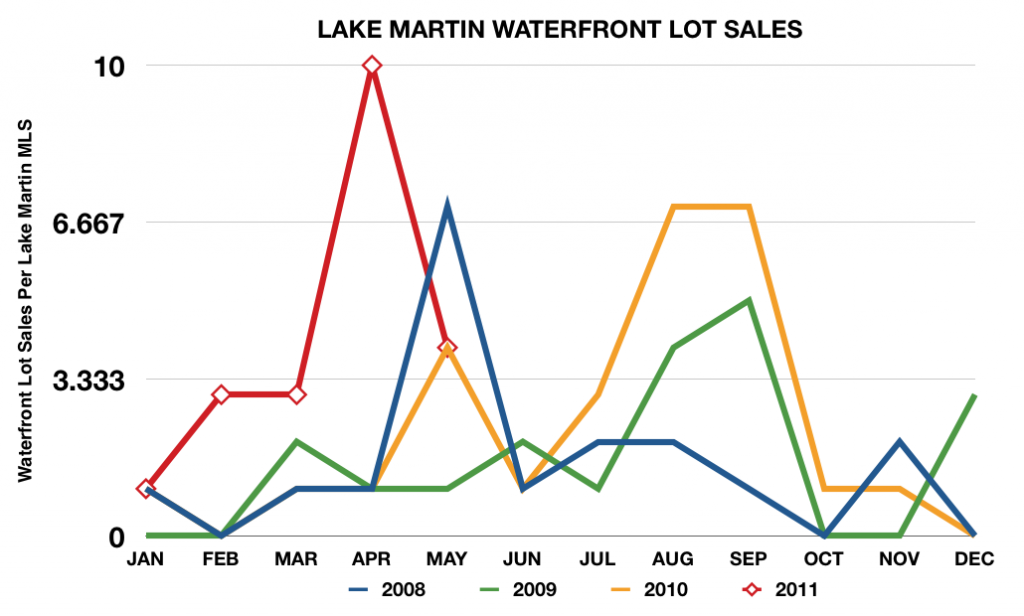
Another bit of big news is the huge increase in waterfront lot sales for 2011. Looking at the entire Lake Martin market, 4 lots were sold in May, 2011. This equaled May 2010. If we consider the entire calendar year, we are trending above 2010, which was a boom year for lot sales.
 |
Looking Ahead
Obviously, we have many more months to go so it doesn’t pay to get too ahead of myself. But I do think that so far we can draw two conclusions:
1.) Lake Martin waterfront home sales for 2011 will be strong again, matching or beating 2009 and 2010. Personally I would not be surprised if it ends up at 10 – 15% higher than last year. I think this also gives a little upward pressure to prices, if not this year, maybe 2012. Preliminary looks at June numbers look strong.
2.) Lake Martin lot sales in 2011 will again be strong. I think 2009 will be the bottom for lot sales, and it’s interesting to me that its bottom happened 12 months after the waterfront home sales bottomed. If lot pricing follows home pricing behavior, then we will see that 2011 will be the year that Lake Martin waterfront lot prices stop dropping.
One Final Tidbit
I always puzzle a bit when the numbers don’t match my gut. For the last 60 days or so something has been gnawing at me. We know that real estate prices are still low on Lake Martin. Check. We know that there are many waterfront homes for sale right now. Check. So:
Why am I having to hustle so hard on the last 3 or 4 deals I have done?
By hustle I don’t mean work in general. Not looking for pity. What I mean is that on these  deals it seems like each one of them has had 2 or 3 other buyers at the sixteenth pole.
To drop the sports analogies, it seems like the “good deals” are being snapped up faster.
Am I correct? If so, that would mean that we have a high majority of homes that have been for sale for a really long time. The dogs (bad deals or junky situations) and the dreamers (sellers that are being ridiculous) are so numerous that it clouds judgement of the market as a whole. But is that a fact? And how can I go about proving or disproving my gut?
If anyone out there has a suggestion for metrics, please let me know.
Related Posts:
Lake Martin Real Estate Sales 2011 – Through April
Lake Martin Real Estate Sales 2010 – Lot Sales
Lake Martin Real Estate Sales 2010
Lake Martin Real Estate Sales 2009 – Year In Review
Lake Martin Real Estate Sales 2008 – Year In Review
Lake Martin Real Estate Sales 2007 – Year In Review
All Lake Martin Market Reports
(*)Disclaimers: All of the above info was taken from the Lake Martin Area Association of Realtors Multiple Listing Service. Accuracy is not guaranteed but deemed reliable. The above does not include sales by FSBOs or developers that sell privately and not through the MLS. But, I do think that the above represents a very large majority of all waterfront sales on Lake Martin, Alabama.

