Lake Martin Waterfront Lot Sales 2011

Lake Martin Real Estate Sales 2011 – Year In Review
January 25, 2012
Lake Martin Foreclosure And Condo Sales In 2011
January 27, 2012Lake Martin Waterfront Lot Sales 2011

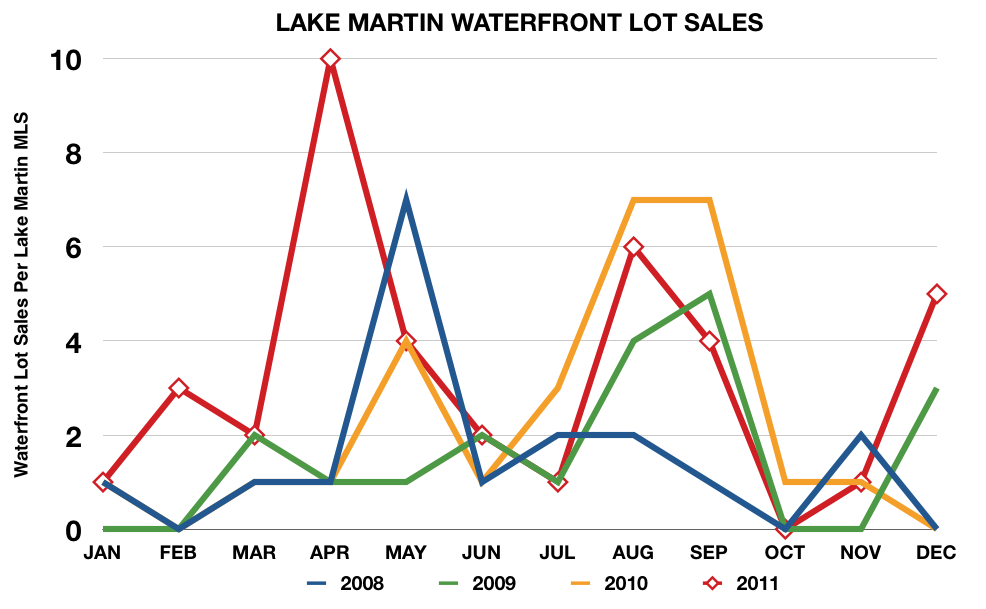
Waterfront lots sold well at Lake Martin in 2011. We the members of the Lake Martin Area Association of Realtors MLS* reported 39 waterfront lots were sold, which was 44% better than 2010 and more than double the total sold in 2008.
If you missed my Lake Martin Year End Review 2011 post where I covered the basics of homes and condos sold last year, please click here. Back to lots …….
 |
Last year when I covered Lake Martin’s waterfront lot sales for 2010 in this post, I called 2010 the comeback year for lot sales. Any time you have a 42% increase (19 to 27), that’s a comeback. 2011 posted another huge gain – 44% – over last year. I guess that is a Secretariat-eque, shut the competition down, stretch run.
Lake Martin Waterfront Lot Prices
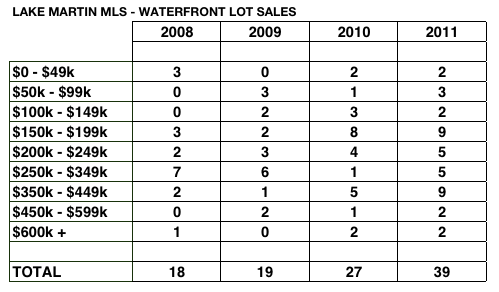
The next thing I wondered about Lake Martin’s lot sales was the price distribution. What are lot prices like? The careful reader knows that I confess an almost prideful love of the lovely bell curve that the line chart of homes sales prices makes. Does the phenomenon repeat itself with lot sales?
Sadly, no. I tried for like 2 hours to make an informative yet pretty and easily readable chart to display Lake Martin lot sale price distribution. I could not make it work. My chart skills with Apple’s Numbers program are lacking and I just don’t think such a small sample works. I guess maybe I have to break the sales bands down to a very small increment, say $20,000. But that felt like I was imposing a result on the chart, instead of just following where the numbers led me, so in the end I decided to merely post the chart with the source data. It is pretty easy to read, anyway.
I also think that when you have a small sample pool as we do with waterfront lots, it makes better sense to drill down to examples rather than looking at macroeconomic trends.
 |
Lake Martin Lot Sales Trends
When I look at the sales results since 2008, I think that I see the greatest change in the price range of $150k – $199k, and then also in the $350k – $449k range. Those price bands jump out at me as the ones with the most relative increase in sales.
The $150k – $199k range didn’t really surprise me. That is the meat of the market and one would expect good sales there in any good year. The spurt of 9 sales in the $350k – $449k range is interesting and worth a closer look.
It turns out, as I expected, that all nine of them are in deed restricted neighborhoods with covenants. That is not too surprising in that most people that buy a high end lot on Lake Martin would like the protection of neighborhood covenants. True, there is a fair contingent of lot buyers who chafe at the yoke of Architectural Review Committees, but apparently at this price range most prefer it.
Also, of the nine waterfront lots sold in this range, seven were in neighborhoods developed by Russell Lands. Does this mean lot buyers seek out their lots? I can’t tell for sure, but I doubt it. I think it is simply a function of numbers. Most Lake Martin lots above $200,000 are in Russell Lands neighborhoods, so odds are that they will show up in the sales results. For this particular range of $350k – $449k, four were in The Ridge, two were in Willow Point, and one was in River Oaks to round out the seven. The two that were not in Russell Lands developments consisted of one in Marina Marin and the other in a small neighborhood called The Overlook on Lake Martin. It is off of Old Tree Road near Martin Dam.
Effect Of Neighborhoods On All Lot Sales
Next I began to wonder about all of the waterfront lot sales on Lake Martin. How many of them are in deed restricted neighborhoods? How many lot sales were the quintessential quaint country lot, free of covenants, where every man is his own master?
The answer is –> not many. Of the 39 waterfront lots sold on Lake Martin in 2011, only 9 of them appear to be free of covenants and are outside of neighborhoods. Now, I must alert you to a huge warning – I am only guessing at their restrictions here. Of those 9, maybe some do have restrictions and I just can’t tell from the MLS or from prior knowledge. But of the 30 that I counted as having covenants, those I am positively sure that they are in neighborhoods.
Interestingly, the highest price lot sale that was outside of a neighborhood was $300,000. There were two in the $150k – $200k range, but the rest were under $150k.
A last thought – being inside a neighborhood doesn’t guarantee a high sale price. The lowest priced lot sold in 2011 was in River Oaks, a Russell Lands development, and sold for $45,000. Before you ask – yes, it was in the back of a slough and had minimal waterfront and minimal water depth. I referenced it when a builder called me yesterday. He wanted to spend $50,000 for a lot, but it had to have year round water, a good view, and over 100 feet of shoreline on a private lot. Sorry, I said. Not going to happen.
Effect of Foreclosures on Lake Martin Lot Sales
How many of the lots sold on Lake Martin in the last two years were bank owned, REO, or foreclosures? Was this responsible for the sales increases?
I think the answer is not so much. Sixty six waterfront lots were sold from January 1, 2010, to December 31, 2011. I searched the owner name on all of these and eleven appeared to be foreclosures. The reason I had to make guesses on owner names is that in our MLS, we didn’t have a field marked “Foreclosure” until 2011. Going forward we will be able to search by that field. But since this included 2010, I had to guess at the owner name and trust that the listing agents had them right.
Eleven foreclosed lots out of 66 gives us about 17%. While that is higher (I think) than the percentage of foreclosed waterfront homes that were sold, it’s not that much higher. My gut tells me that only about 10% of homes sold in 2011 were foreclosures. If we reduced the foreclosed lots down to 10%, it would only be a 5 lot reduction, moving the sales totals to 34 for 2011. Still an excellent year.
Verdict: foreclosures affected lot sales only a little. I was surprised on this, I thought it would be more.
Do You Have Any Questions?
As I continue to break the numbers down for waterfront real estate sales on Lake Martin, please feel free to email with this form or at [email protected] with questions. I get my best ideas from my readers and clients so please feel free.
I think next I will look at residential sales again, and study the effects of foreclosures and condo sales.
Related Posts:
Lake Martin Real Estate Sales 2011 – Year In Review
Lake Martin Real Estate Sales 2010 – Lot Sales
Lake Martin Real Estate Sales 2010
Lake Martin Real Estate Sales 2009 – Year In Review
Lake Martin Real Estate Sales 2008 – Year In Review
Lake Martin Real Estate Sales 2007 – Year In Review
All Lake Martin Market Reports
(*)Disclaimers: All of the above info was taken from the Lake Martin Area Association of Realtors Multiple Listing Service. Accuracy is not guaranteed but deemed reliable. The above does not include sales by FSBOs or developers that sell privately and not through the MLS. But, I do think that the above represents a very large majority of all waterfront sales on Lake Martin, Alabama.

