Lake Martin Market Reports Yield Great Feedback

8th Annual Tallapoosa Basin Conference
April 30, 2014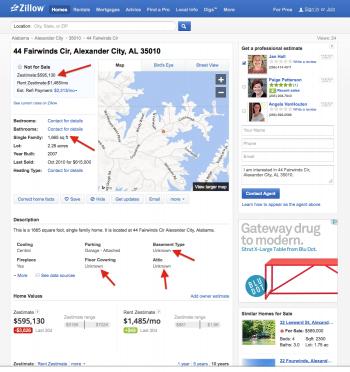
Why Zillow and Trulia are a Waste of Time at Lake Martin
May 9, 2014Lake Martin Market Reports Yield Great Feedback

The Lake Martin waterfront real estate market is a unique animal. I try hard to provide meaningful market reports, built on math and not assumptions. I recently sent out my 2013 Year End Review via email. In it, I asked for suggestions on how to improve my report.
 I received two very interesting emails, and thought I would publish them here. I would like to once again thank these readers for their input, and continue to ask for suggestions, and challenges, to my published numbers and analysis. With such a small number of homes sold each year, it’s critical to have good information. You won’t ever hurt my feelings if you think I am wrong or looking at something the wrong way. On the contrary, I would love to hear from you.
Here is the first email:
On Feb, 2014, “Paul” wrote:
Just read though your email – great to see sales and construction activity continue to climb. You mentioned that you do not necessarily see price appreciation…..yet. Presumably you have the aggregate of sales dollars per annum. Does that not evidence any increase in avg sale/property?
Just curious because I was wondering how much the rate environment (which is still very favorable) could have an impact on discretionary/second home real estate purchases.
And my response:
Begin forwarded message:
From: John Coley
Subject: Re: sales data
Date: March, 2014
To: “Paul”
Hey “Paul,” thanks for your email. I don’t really look at aggregate sales dollar figures because I am not sure it is representative. For instance, the aggregate sales data in 2013 is going to be about double of 2008. But – 263 homes were sold in 2013 compared to 137 homes in 2008. If you looked at aggregate sales data you would be tempted to conclude that values have doubled since 2008, which certainly does not meet the smell test. I don’t know of any market anywhere that has doubled since 2008. In fact, I think values dropped slightly in 09 and have been steady since then. My bell curve chart and real world examples (homes bought in 08 that are for sale now) confirm that. But it is certainly interesting to consider.
As to interest rates – I don’t think rates mean a hill of beans to the average buyer. I think their interest rate sensitivity is zero. I have never run the numbers, but now that I know how to do so (I plan to do it like I did for WF footage and lot size) – I might try it. Stay tuned to my blog in the next few weeks, I am publishing the math behind my studies of price per WF foot.
Great to hear from you!
And the second email:
Dear John:
You asked for input on your charts, so being a CPA I couldn’t resist giving some! The chart you are using to determine whether prices are increasing I don’t think is accurate for that purpose. For example, let’s say in 2014 a lot of people in the $700,000 price range bought a lot of houses, let’s say 25% of all 2014 sales – the chart would of course spike at the $700,000 level indicating only that more people are buying houses at that level than they did in previous years. If the $700,000 buyers were buying houses that were previously sold for significantly less (i.e. a big price increase had occurred), the chart would not indicate that.
I don’t know if you have the data, but I believe a very meaningful chart re: price fluctuations would be to calculate the dollar sales per square foot, by subdivision, by year. That would certainly capture any price fluctuations. Since the subdivisions are all in different categories (i.e. comparing the Ridge to Trillium, or Blount’s Point area to Willow Point) cannot be meaningfully done.
I would love to see a chart that lists sales dollars per square foot, by subdivision, by year. Can you get your hands on that kind of data?
Many thanks for your very valuable research.
– “C.E.”
My response:
From: John Coley
Subject: Re: Lake Martin – February 2014
Date: March, 2014
To: “C.E.”
Hey “C.E.”, thanks for your email. I appreciate a fellow numbers guy giving me input. I am always on the lookout to build a better mousetrap and to similarly test assumptions of my own.
Re: per square foot – I think this stat is extremely misleading at the lake. The reason is that so much of a home’s value is tied up in the lot. PSF analysis works well in things like condos where everything is the same, but lake property is way too diverse and has too high a percentage of overall value tied up in the lot. See a post I did on my blog, way back in 2007:
5 Mistakes When Buying Real Estate on Lake Martin
There is zero correlation between sales price and square footage of home.
In that post I also mention the price per waterfront foot of a lot and its deceptive nature. Coincidentally, I just ran the numbers on that using 2013 sales. I will be posting the results on my blog. I did a scatter plot, and a correlation coefficient calculation. Where +1 is a perfectly direct relationship, 0 is no relationship, and -1 is a perfect indirect relationship, I found that waterfront footage only has about a 0.47 correlation, or classified as a secondary correlation by statisticians. Interestingly, the size of the lot (overall acreage) has a zero correlation. This math confirmed for me that when I am valuing lots, and therefore valuing homes, the most accurate method is to start with a comparable sales method, looking at similar location, view, privacy, and water quality. I secondarily adjust for WF footage, and do not adjust at all for acreage.
I will take a look at your suggestion of analysis by neighborhood. I am doing that already for a neighborhood report, but looking at PSF data on homes in a neighborhood will vary even more greatly because of our small sample pool. That’s why I only do price analysis once a year – in Willow Point there were only 8 homes sold in the last 12 months, from 600k to 2.2 million. When your sample pool is that small, it won’t normalize easily, and one home sale can thrown the whole thing in a wreck and make year to year comparisons inaccurate at worst. But all this does make for interesting discussion!!!
Regarding your example of the 700,000 category – if you look at the most recent example, in 2011 there was a spike in the over 1 million range. You can see the hump up there. Spikes like this are the prime reason I broke it all down to price strata, and also to look a year’s worth of sales. I am trying to normalize out the outliers. But again, great food for thought! Thanks!
Thanks for your email!!
It is so humbling that people read my market reports, much less take the time to comment on them and get me to really think about the conclusions I draw. It helps more than you know. A huge thanks for your feedback, and please keep it coming!
C.E., in a later email, suggested that I look at the percentage of and direction of change in per square foot pricing on Lake Martin waterfront home sales. His point was that while the raw number might not be useful, the direction thereof might be, kind of like the DJI in the stock market. I think this is a cool idea and worth some further study!
   |