Lake Martin Real Estate Sales – 2012 Year End Review
2013 Russell Forest Run 5K and 10K
February 12, 2013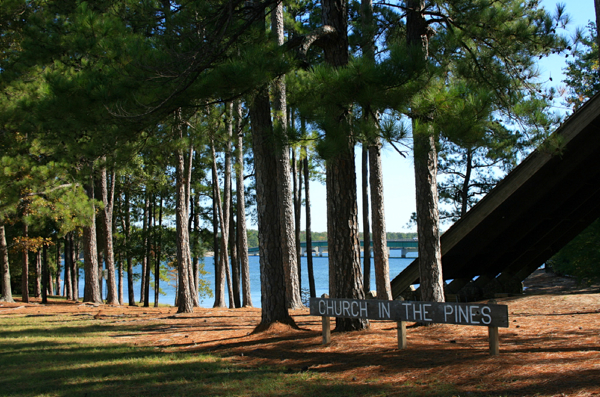
Church In The Pines: Popular Lake Martin Wedding Venue
February 16, 2013Lake Martin Real Estate Sales – 2012 Year End Review
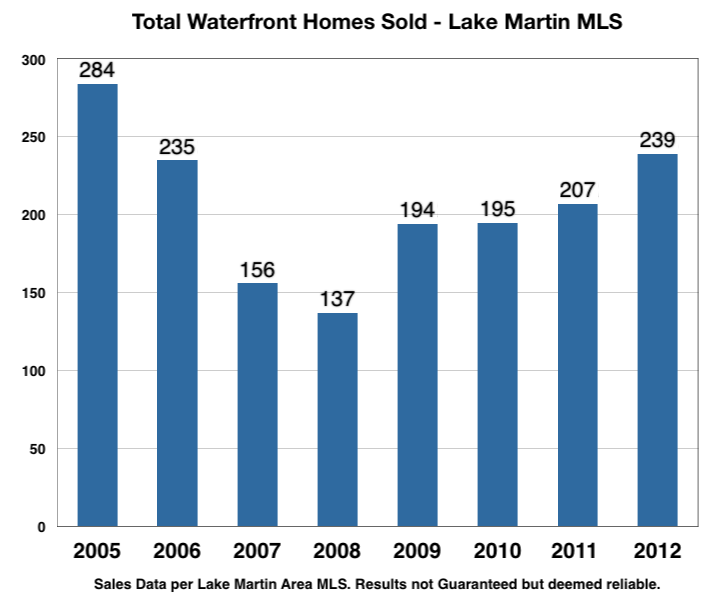
Lake Martin waterfront home sales had the second best year on record in 2012. According to the Lake Martin, Alabama, area MLS, 239 waterfront homes were sold, compared to 207 in 2011.
This represented a 15.4% gain over the prior year!
 |
The Lake Martin Area MLS* gathers data from all its members, so this number includes every agent, every brokerage at Lake Martin. The previous best year for vacation home sales on Lake Martin was 2005, when 285 homes were sold. 2012’s total of 239 beats out the previous second place winner of 2006, when 235 were sold.
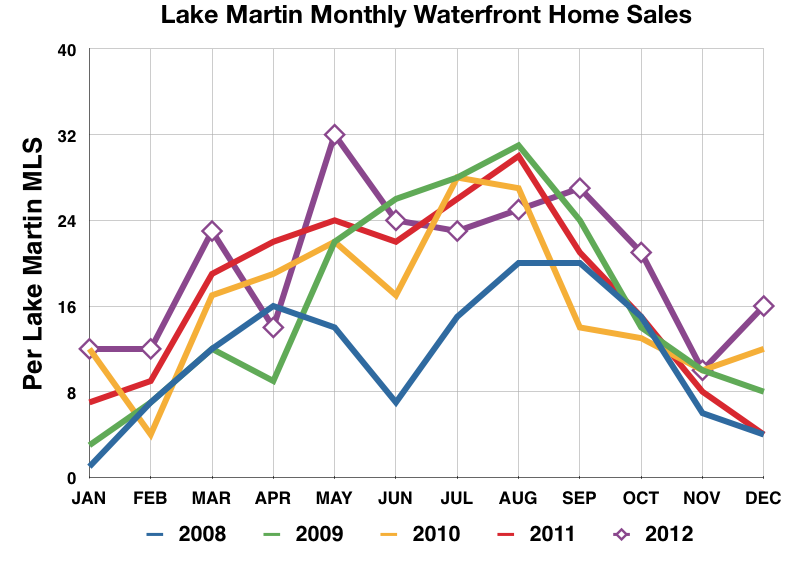
Here at Lake Martin Voice we had a really good idea that the Lake Martin real estate market would have such a sales report for 2012. In this post I wrote concerning waterfront home sales in November 2012, we knew that we were setting up for a very good situation, we just didn’t know how good until the December results were posted.
I also noticed that a few sales were added to prior months. If you go look at the November 2012 market report, that I wrote on December 10, 2012, you will see that 26 homes were reported as sold in September 2012. Since then, that number changed to 27. That is because our MLS* is only reporting the information that each Lake Martin realtor or broker inputs. Why did it change? Who knows. Maybe someone realized they had the sale date wrong, and corrected it. This happens fairly frequently. I think we can assume that, as we look over the course of eight years, that an equal amount of mistakes happen each year. At any rate, this is the best data we have.
 |
The Lake Martin real estate market also received some favorable attention from the ACRE news flashes. ACRE is the Alabama Center for Real Estate, and it compiles statistics for the entire state. They recently posted this article about the Lake Martin area’s gain of 10.7% homes sold versus 2011. Please keep in mind that ACRE pulls numbers straight from the Lake Martin Area MLS, which includes off water homes in Alexander City, Dadeville, et al. The numbers I quote above of 239 home sales for 2012 and a 15% gain are taken from that same database, but filtered to give Lake Martin’s waterfront home sales only.
2012 A Winner Over Prior Year
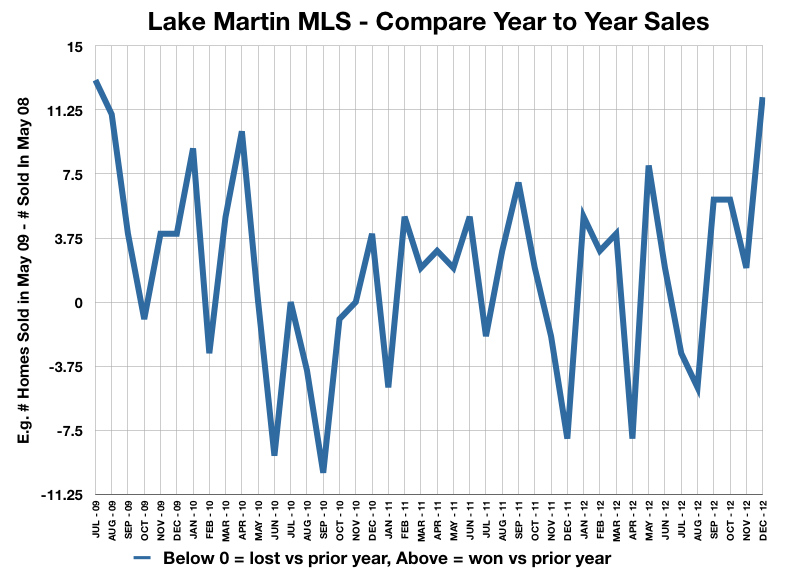 |
When it is all said and done, the most any real estate market can ask is to have beaten the prior year in numbers of homes sold. This goes for Lake Martin or any market at any time. I have said many times over my years of doing these Lake Martin real estate market reports that I really focus on this statistic, especially at the month to month level. I first read about this metric from Nicolai Kolding’s brilliant blog posts, who was then at Better Homes and Gardens but now is at Weichert. I started tracking the current month versus same month prior year sales a long time ago, and my research indicates to me that the Lake Martin Market turned for the better in July 2008, although 2008 as a year was the worst of the bubble crash.
2012 Waterfront Home Prices on Lake Martin
I think prices remained steady in 2012 at Lake Martin. Please see the below graph for my reasoning.
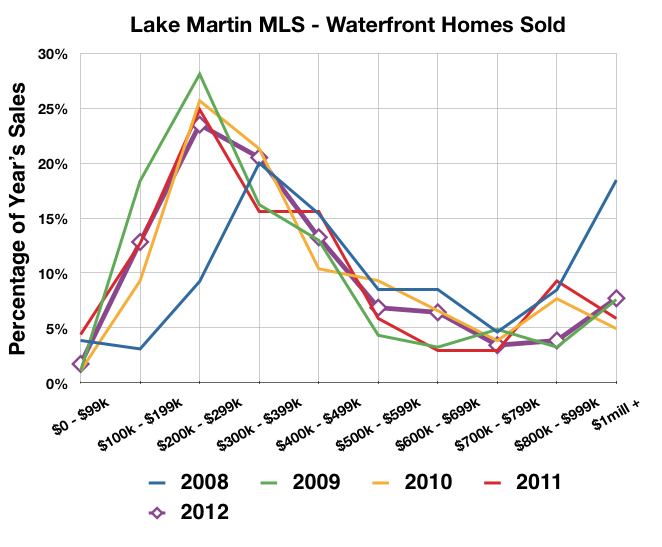 |
Long time readers of this blog know that I only look at Lake Martin home prices once a year. That’s because we are such a rural market, we have so few monthly sales on any given month, that if one tracks average prices per month, wild (80%) swings are seen. Monthly average sales price is not a reliable statistic because the sample pool is just too small. My response is to look at sales price trends once per year, to break them down into “bands” of about $100,000 each, and to look at them in terms of how much each band represents sales as a whole.
For instance, if you look at the above chart, you can see that of the homes sold in 2012, about 24% were sold in the price range of $200,000 to $299,999. This was the largest price segment for the fourth year in a row. The bell curve did not totally shift to the right, which would indicate to me an overall market increase in price.
However, if you take a close look at the above bell curve for 2012, you can note that in other price segments like the $300,000 to $399,999 there was an increase in market share. While it was not enough of a shift to indicate an overall market price increase, it does make me optimistic that one is possible in 2013. It also does not match my intuition gained as an agent with “boots on the ground” this past year. In my gut, it felt like prices were increasing just a tad. Maybe I am wrong. Or maybe I just need to break these pricing segments down tighter than $100,000 increments.
Maybe that’s a subject for a future market report.
Please stay tuned to this blog as I continue to pour through Lake Martin’s 2012 real estate sales results for waterfront properties. I will be looking at waterfront lots, the effect of foreclosures, and also be drilling down inside particular neighborhoods and areas.
Can I help you?
I am a full time Lake Martin real estate agent. I write this blog to help the public and myself stay up to date on Lake Martin real estate. I would love to be able to help you buy or sell a Lake Martin property. Please call me at 334 221 5862 or contact me by filling out this form.
Related Posts:
Debunking The Labor Day Price Drop Myth
July Sales Cool
Lake Martin Lot Sales 2011
Lake Martin Real Estate Sales 2011 – Year In Review
Lake Martin Real Estate Sales 2010 – Lot Sales
Lake Martin Real Estate Sales 2010
Lake Martin Real Estate Sales 2009 – Year In Review
Lake Martin Real Estate Sales 2008 – Year In Review
Lake Martin Real Estate Sales 2007 – Year In Review
All Lake Martin Market Reports
(*)Disclaimers: All of the above info was taken from the Lake Martin Area Association of Realtors Multiple Listing Service. Accuracy is not guaranteed but deemed reliable. The above does not include sales by FSBOs or developers that sell privately and not through the MLS. But, I do think that the above represents a very large majority of all waterfront sales on Lake Martin, Alabama.
   |

